

Built for Operators Who Think in Portfolios.
From bank statement to board-ready financials — here is exactly how it works.
The AutoBooks Flow
STEP 01
You Upload
Drop your bank statement CSV into your designated Google Drive folder. That is your entire job for the month.
STEP 02
AI Reads Every Transaction
Claude categorizes each transaction by property using payee names, amounts, and portfolio knowledge. No manual entry.
STEP 03
Nelson Reviews Every Entry
Every categorization is checked by Nelson Rosa, CPA before anything reaches you. Nothing ships without sign-off.
STEP 04
Ledger Closed
Your Beancount ledger is updated, balanced, and signed off. Month closed.
STEP 05
Report Generated
Property-level P&L. Plain-English CFO summary. Three action items. Delivered before your strategy call.
STEP 06
You Decide
With current, accurate, CPA-reviewed financials — you make better portfolio decisions faster.
Your Client Dashboard
Not a Spreadsheet. Not a PDF. A Dashboard Built for Decisions.
Every month when your books close, your client dashboard updates automatically. Not three weeks later. Not in a format you have to decode. A live visual dashboard showing exactly where every dollar went — and what it means for your portfolio.
We built four views that answer the questions serious STR operators actually ask: Which property is my best performer after every cost? How close am I to losing money on a slow month? What does every additional booking actually put in my pocket? And what does the full picture look like line by line?
Your numbers. Visualized the way you actually think about your portfolio.
Revenue to NOI Waterfall
See exactly how $41,000 in gross revenue becomes $25,000 in net operating income — cost by cost, property by property.
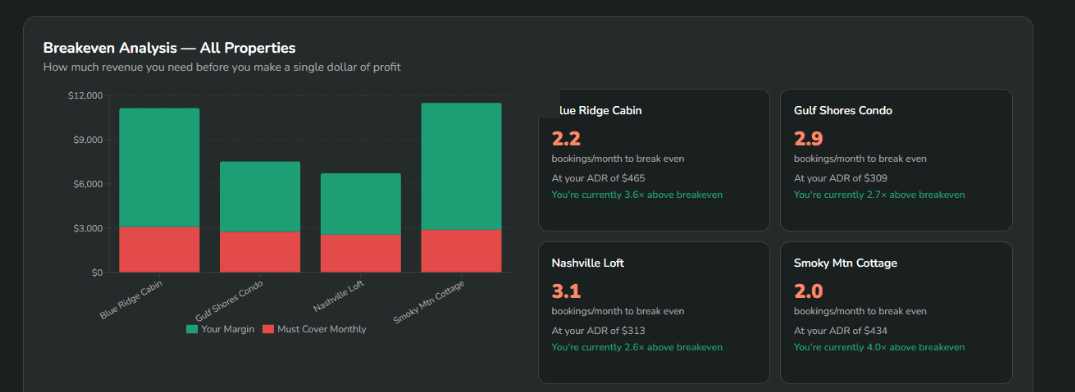
Breakeven Analysis
Know how many bookings each property needs before it makes a single dollar of profit. And how much cushion you have before a slow month becomes a problem.
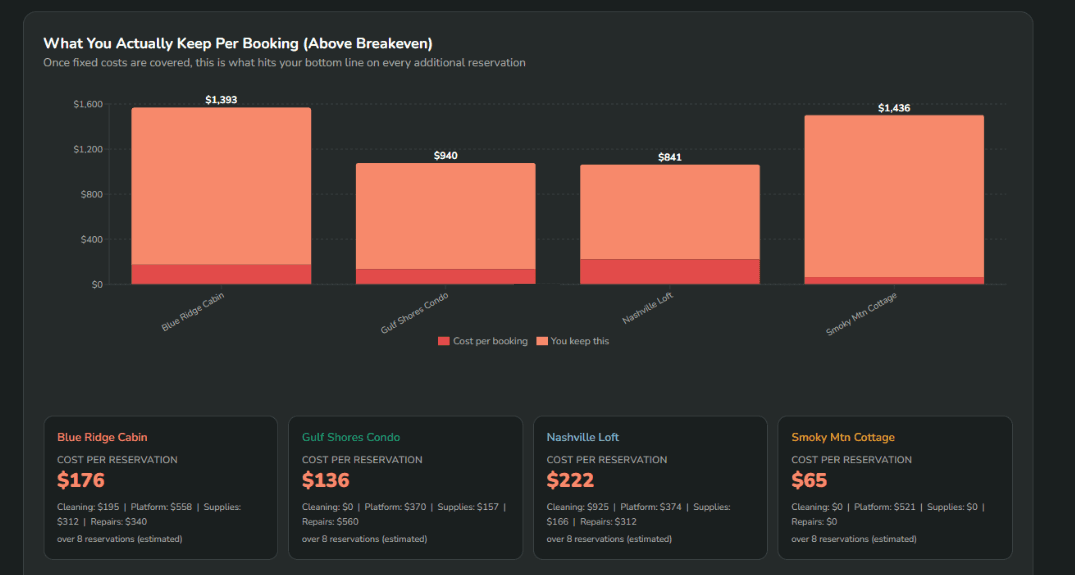
Contribution Margin per Booking
Once fixed costs are covered, this is what every additional reservation puts in your pocket. The number that changes how you think about pricing in slow months.
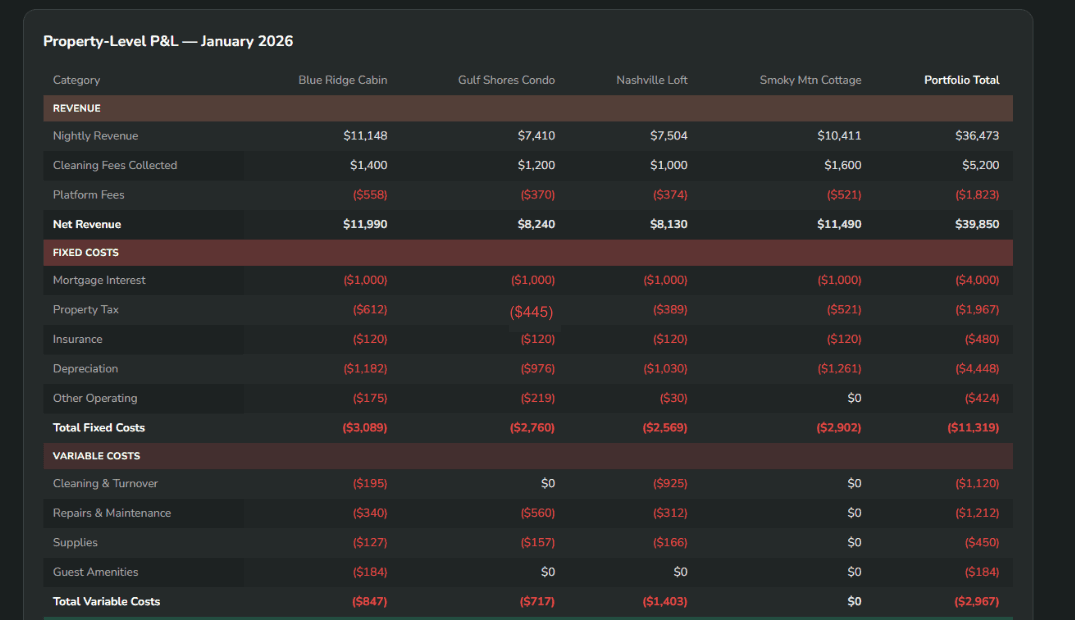
Full Property-Level P&L
Every line item. Every property. Every cost category. Audit-ready and always current — not just at tax time.

“Your accountant should be reachable when you need them — not just at tax time.”
Foundation
48-hour response
Visibility
24-hour response
Scale
4-hour response
AI Speed. CPA Judgment. You Get Both.
What AI Handles
- Reads every transaction
- Categorizes by property automatically
- Splits Airbnb payouts into components
- Flags anomalies immediately
- Keeps books current between closes
What Nelson Handles
- Reviews every AI categorization
- Applies CPA judgment to edge cases
- Signs off on every close
- Interprets numbers for your decisions
- Identifies tax implications monthly
Start With the Free Report.
Upload your Airbnb CSV. See what your portfolio is actually telling you. No email required. No credit card.